See the Hub in action
From zero to real-time monitoring in under five minutes. Here is how a 3CX system goes from added to fully monitored, step by step.
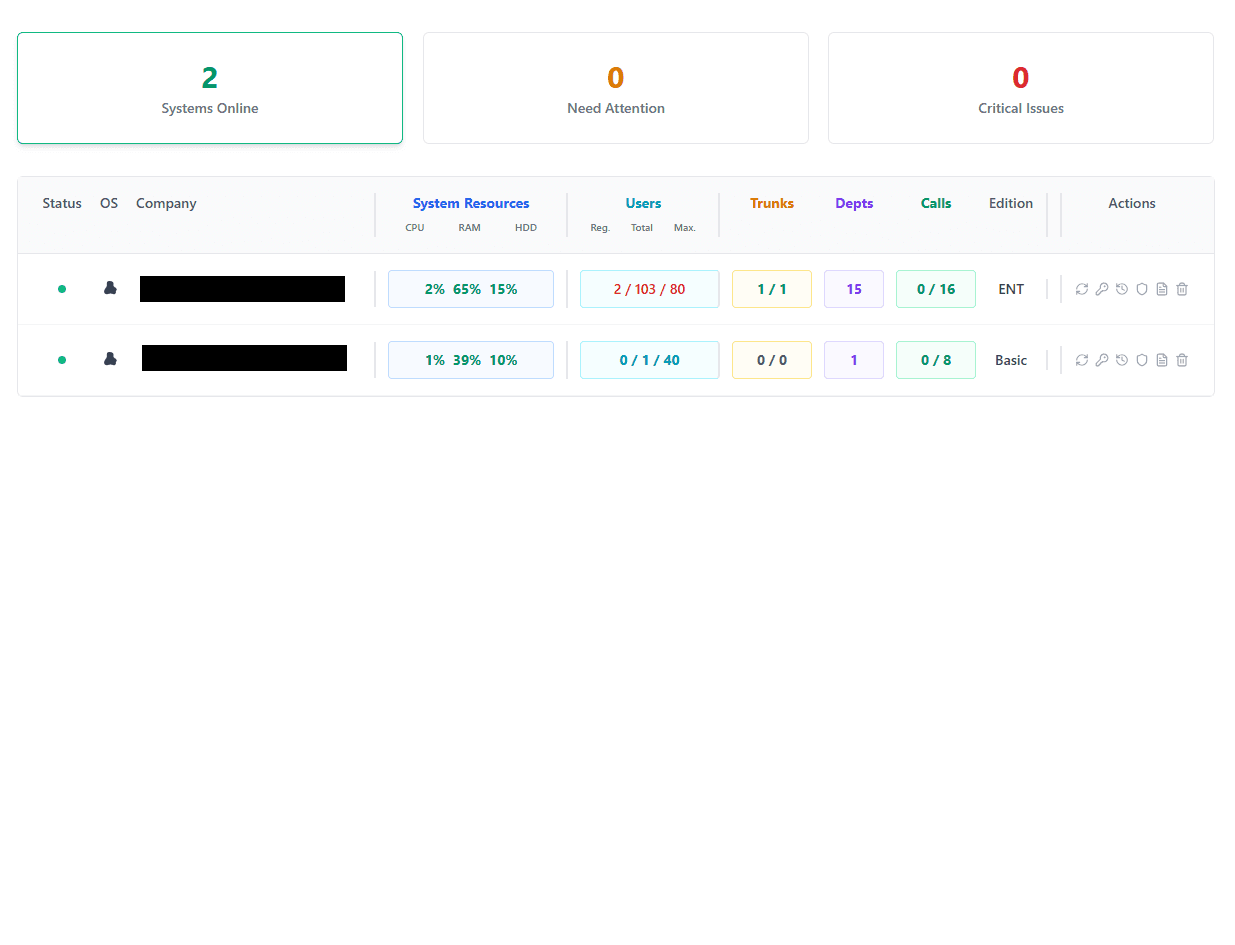
Add your first system
Enter your 3CX FQDN and credentials, whether Enterprise (XAPI) or Pro (Extension login). The Hub connects, verifies the link, and starts collecting data right away.
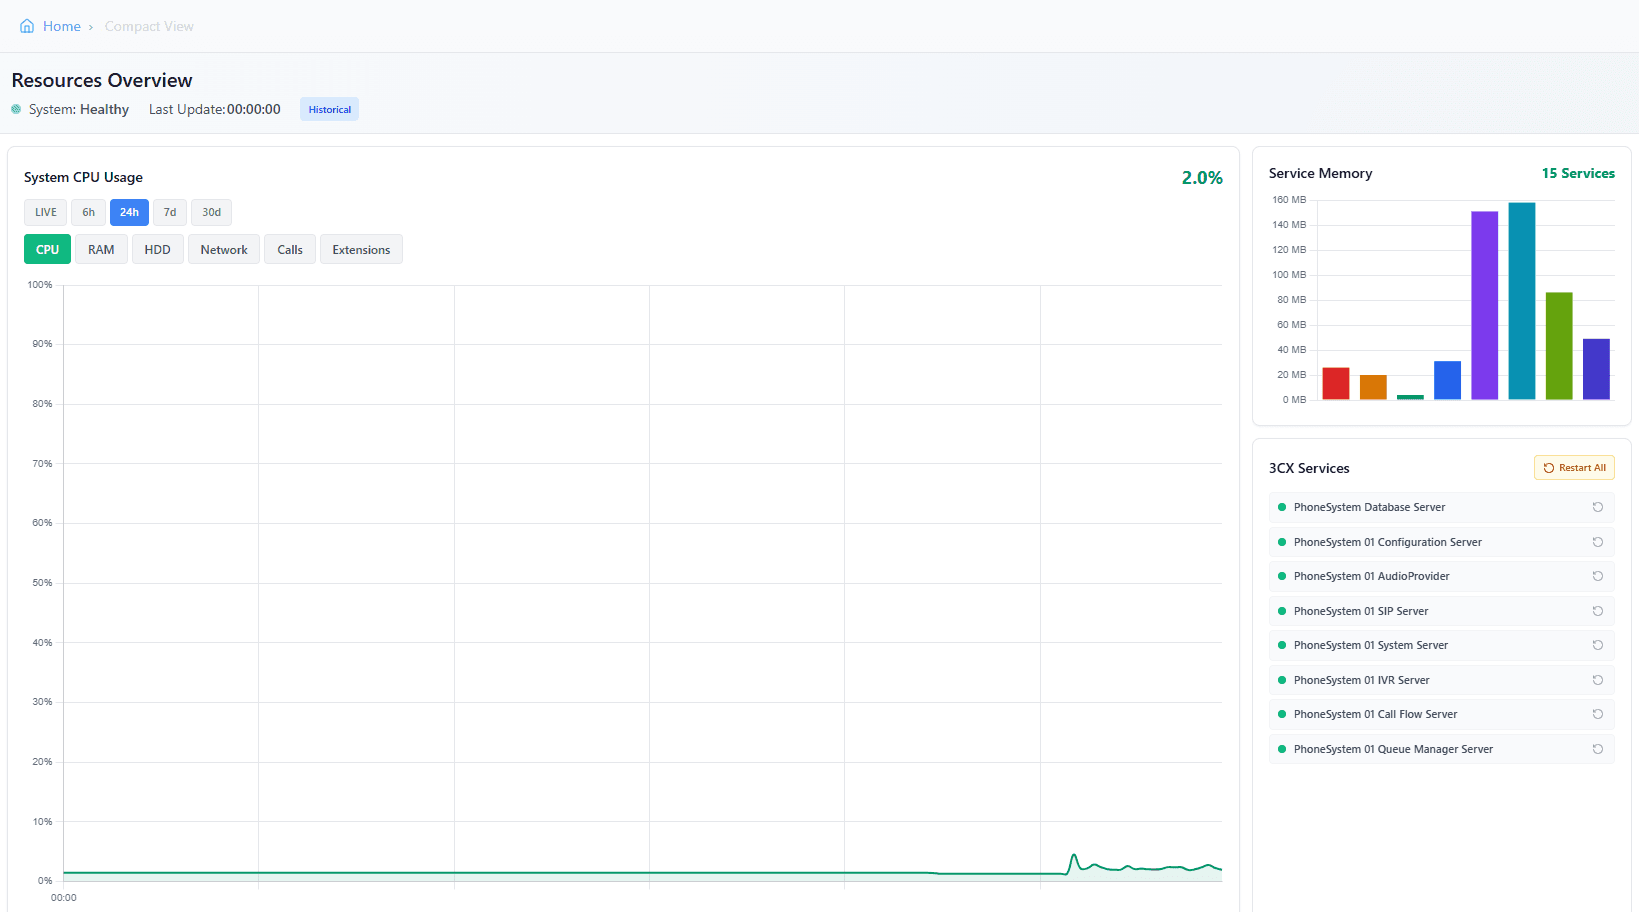
Live telemetry in seconds
CPU, memory, disk, active calls, and extension status stream in every 30 seconds over SSE. No refreshes and no stale data. Historical charts let you spot trends across days or weeks.
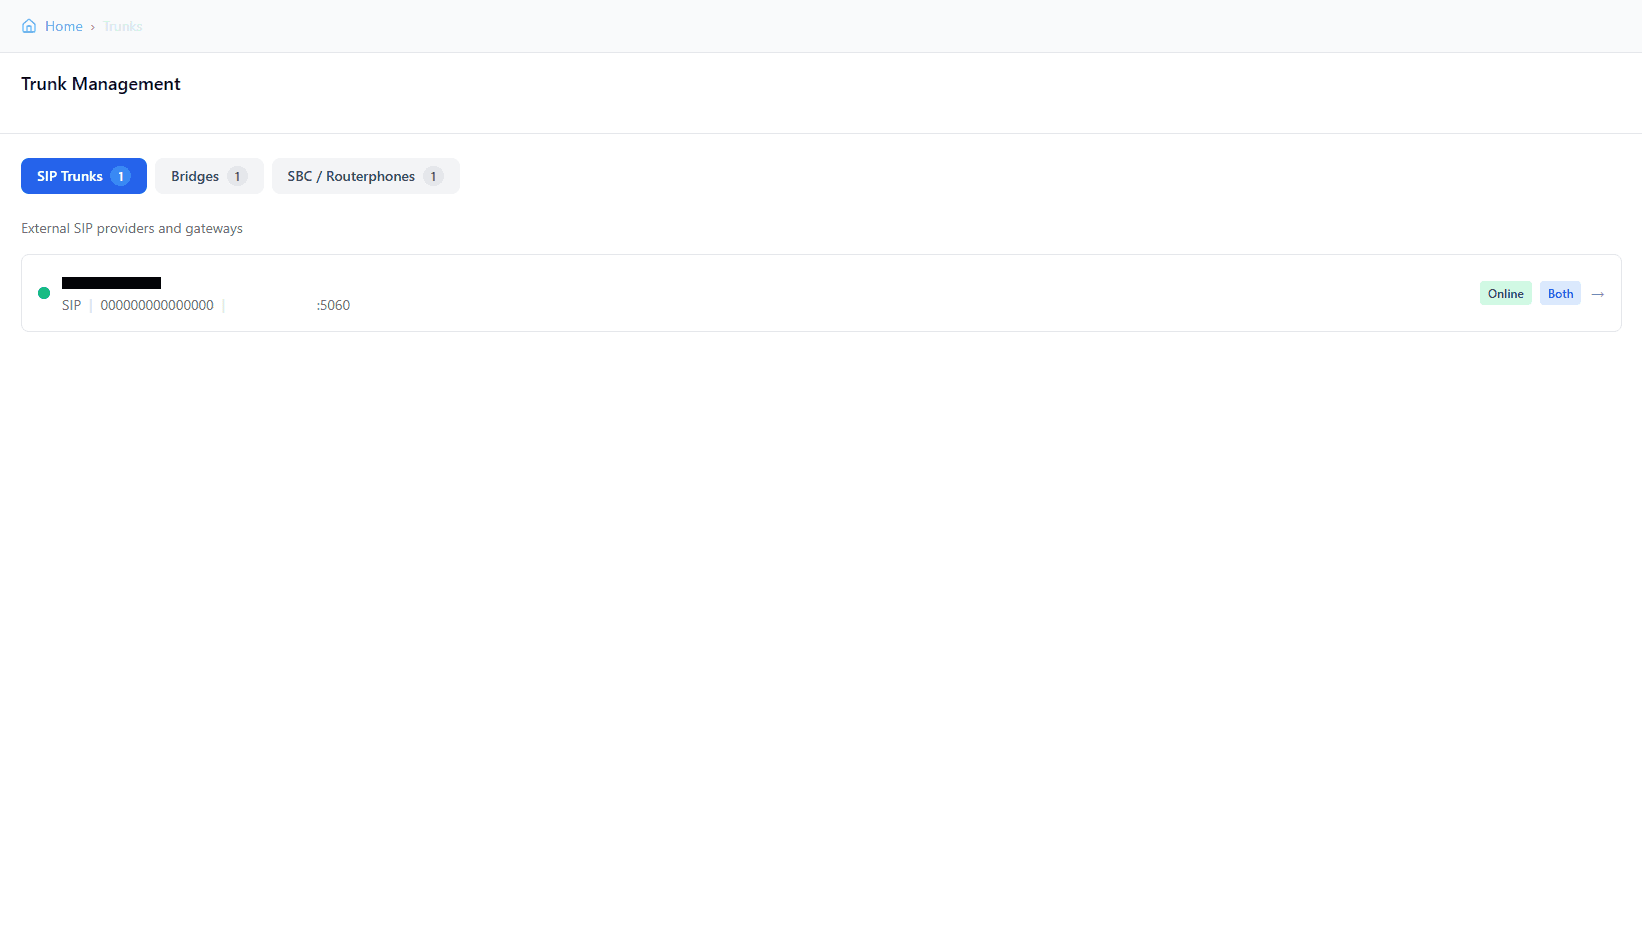
Configure trunks and routing
View and manage SIP trunks, DID numbers, inbound and outbound rules, and SBC devices straight from the Hub. There is no need to log in to the 3CX console.
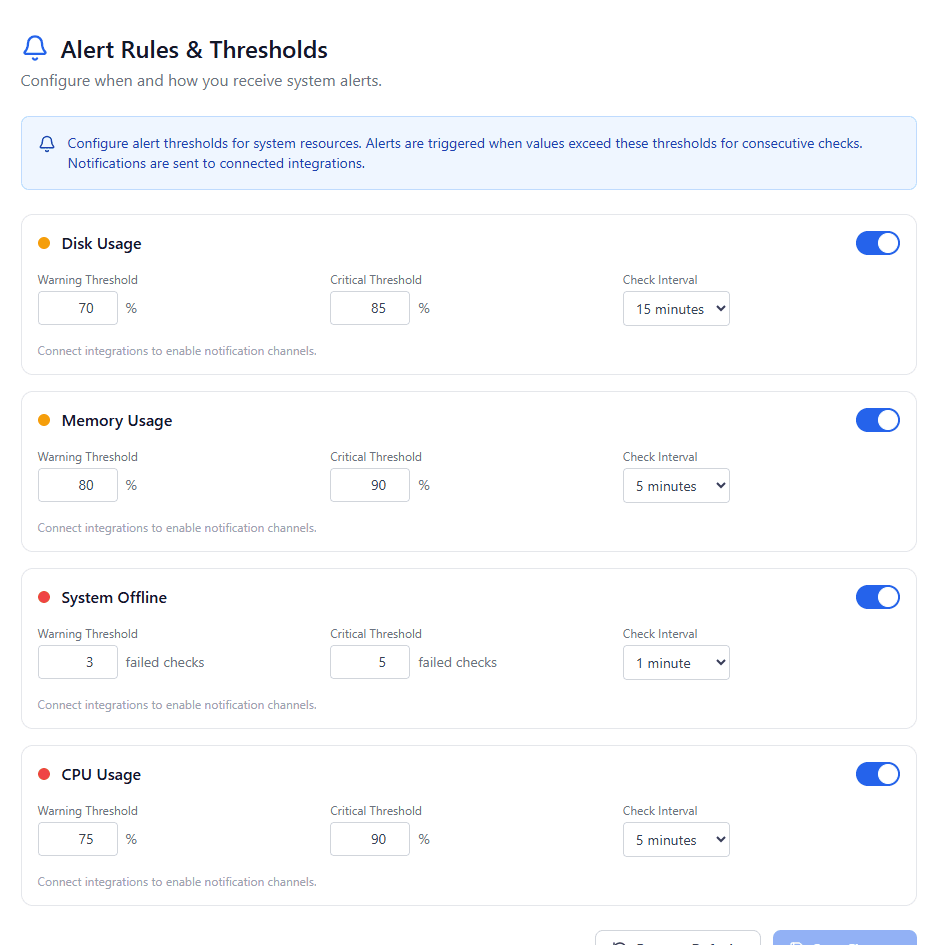
Set up alert rules
Define thresholds for CPU, memory, disk, and offline detection. Get notified by email, Slack, Telegram, or webhook before small issues turn into outages.
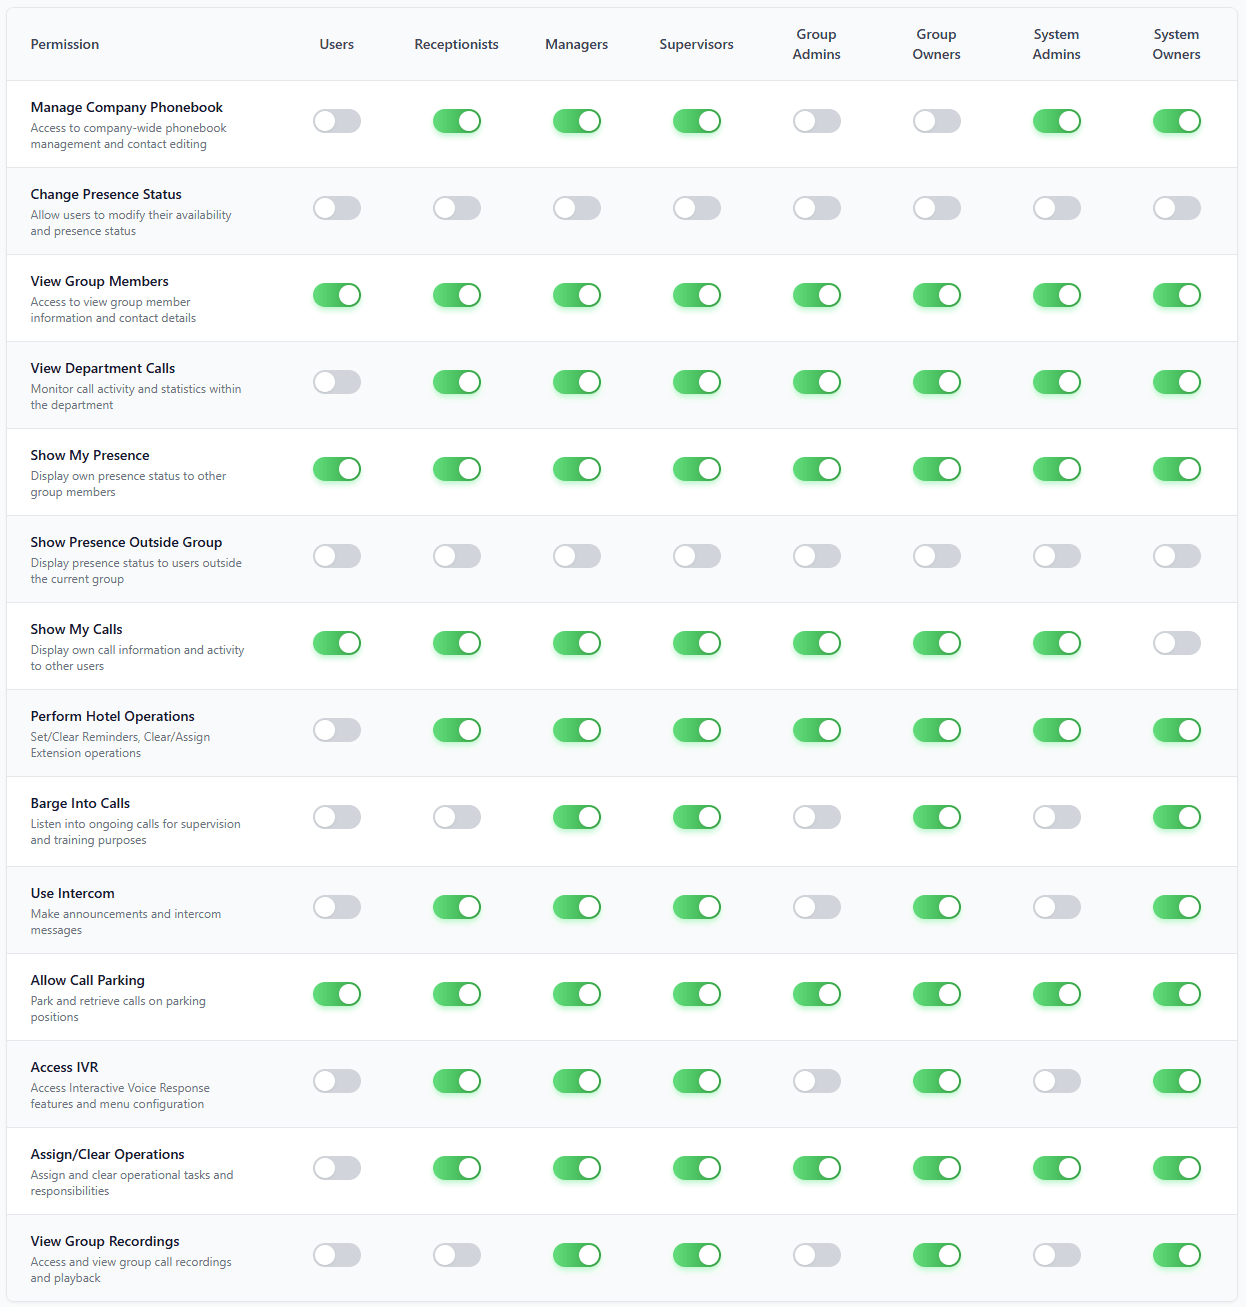
Manage roles and permissions
Control who can see and do what across your 3CX systems. Role-based access runs from System Owner down to User, scoped per department.
Ready to get started?
Add your first 3CX system in under two minutes. Free forever, no credit card required.